Week 4 (3rd–10th February, 2018): Analyzing and interpreting data
|
Click here for Webinar 3 recording
Powerpoint slides here In the third webinar of EVO2018, to introduce Week 4, Richard talked about where we are overall, encouraging you not to worry if you are not keeping up with the exact week-by-week pace. He also shared basic procedures for analysing different kinds of data and guided you to decide on which analysis procedure(s) will be best for your own study. The main follow-up activity is Activity 3 below. |
Activities
Activity 1 (optional)
In some research which investigated what teachers thought about being learner centered, two participating teachers were asked "What does being learner-centered mean to you?". Read the short transcript (CLICK HERE) and analyse the data by going though the suggested steps for qualitative data analysis below. What are the aspects of being a learner-centered teacher according to this data?
Some suggested steps for data analysis:
Now share your analysis in the Google+ Community under '8. Identifying themes'.
In some research which investigated what teachers thought about being learner centered, two participating teachers were asked "What does being learner-centered mean to you?". Read the short transcript (CLICK HERE) and analyse the data by going though the suggested steps for qualitative data analysis below. What are the aspects of being a learner-centered teacher according to this data?
Some suggested steps for data analysis:
- Underline the words/phrases and word groups that are repeated and/or have similar meanings
- Label and name the categories
- Identify the emerging patterns in the data
- If you can, ask a colleague to follow the same procedure
- Compare and contrast your and your colleague's analysis
- List the common themes that emerge
Now share your analysis in the Google+ Community under '8. Identifying themes'.
Activity 2 (optional)
CLICK HERE to access the online book Teacher Researchers in Action. Find a study which interests you and read the data analysis part. How would you answer the questions below?
1. Which study did you choose?
2. How is the data analysed and presented (e.g. charts, figures, tables,...etc)? What calculations have been used (means, percentages, ranking, etc.)?
3. How could the data analysis and data presentation of the study you chose guide your own classroom-based research? Any lessons to be learned?
Now compare your answers with those provided by some participants in EVO 2016 (CLICK HERE)
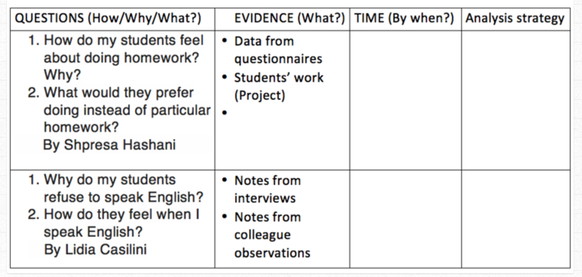
(Main activity this week) Activity 3: Your own data analysis
1.. How will you analyze / How are you analyzing the data you collected / might collect in the future?
2.. As you analyze your data, share your doubts and questions
Share your approach to analysis, and any doubts/questions in our Google+ Community under '9. How will you analyze?'
1.. How will you analyze / How are you analyzing the data you collected / might collect in the future?
2.. As you analyze your data, share your doubts and questions
Share your approach to analysis, and any doubts/questions in our Google+ Community under '9. How will you analyze?'
Additional resources
You can read chapter 6 in the book A Handbook for Exploratory Action Research to reinforce your understanding of data analysis and interpretation and chapter 7 in the same book to consider further 'What next?' after exploratory research
A recent webinar by Emily Edwards provides a good, down-to-earth introduction to action research (one possible next step after the kind of 'exploratory research' we have been promoting)..
This video by David Nunan might help you further with qualitative research and data analysis.
Hoped-for achievements
By the end of this week you will have:
- developed an understanding of how you can sort out the data you have collected as well as how you can categorize and classify them
- posted important information about how you might analyze your data
FOURTH LIVE SESSION: Click here to join us on Saturday 10th February at 15:00 GMT
(Time where you are here). Enter as a 'Guest', writing your full name.
(Time where you are here). Enter as a 'Guest', writing your full name.